

Why Economists Call It the Crystal Ball of the Economy
“If stock markets often reflect today’s emotions, the bond market frequently reflects tomorrow’s expectations.”
Introduction: A Simple Graph That Moves Global Markets
Imagine entering the headquarters of a major investment bank.
A team of economists is discussing inflation, recession risks, employment trends, and central bank policy. Among dozens of financial charts displayed on large screens, one graph receives constant attention.
It isn’t a company’s share price.
It isn’t the price of gold or oil.
It is a simple line showing government bond yields across different maturities.
This line is known as the yield curve.
At first glance, it appears ordinary.
Yet central banks, governments, investment managers, pension funds, multinational corporations, and economists around the world monitor it every day because it provides valuable insight into how investors collectively view the future.
The yield curve does not predict the future with certainty.
However, it summarizes the expectations of millions of market participants who continuously evaluate economic growth, inflation, interest rates, and financial risk.
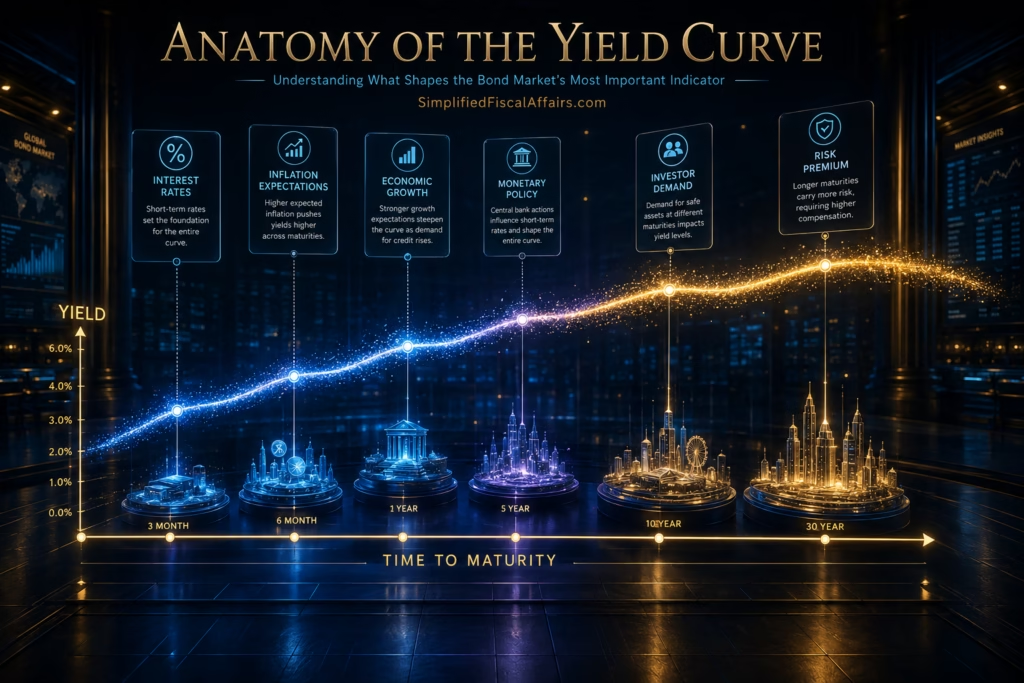
What Is a Yield Curve?
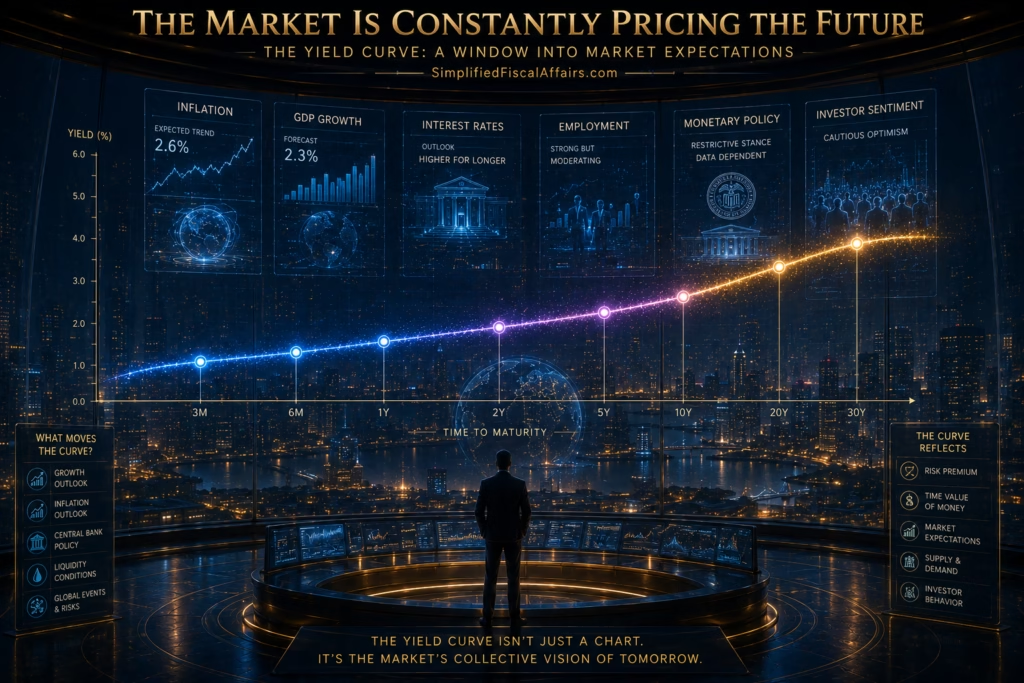
A yield curve is a graph that compares the yields of bonds issued by the same borrower but with different maturities.
For example, a government may have outstanding bonds that mature in:
- 3 months
- 1 year
- 2 years
- 5 years
- 10 years
- 20 years
- 30 years
Each bond has its own yield.
When these yields are plotted against time to maturity, they form the yield curve.
Because the borrower is the same, the primary difference between the bonds is how long investors are lending their money.
This allows analysts to focus on how time influences required returns.
Why Longer Loans Usually Demand Higher Returns
Suppose a friend asks to borrow money.
If the loan lasts only one month, you face relatively little uncertainty.
But what if the loan extends for thirty years?
Over such a long period, many things could change:
- Inflation.
- Interest rates.
- Economic growth.
- Employment.
- Government policy.
- Personal financial circumstances.
The longer the money is committed, the greater the uncertainty.
As compensation for accepting that uncertainty, investors generally expect higher yields on longer-term bonds.
This explains why yield curves are often upward sloping.
The Three Common Shapes of the Yield Curve
Although yield curves can take many forms, three broad patterns appear most frequently.
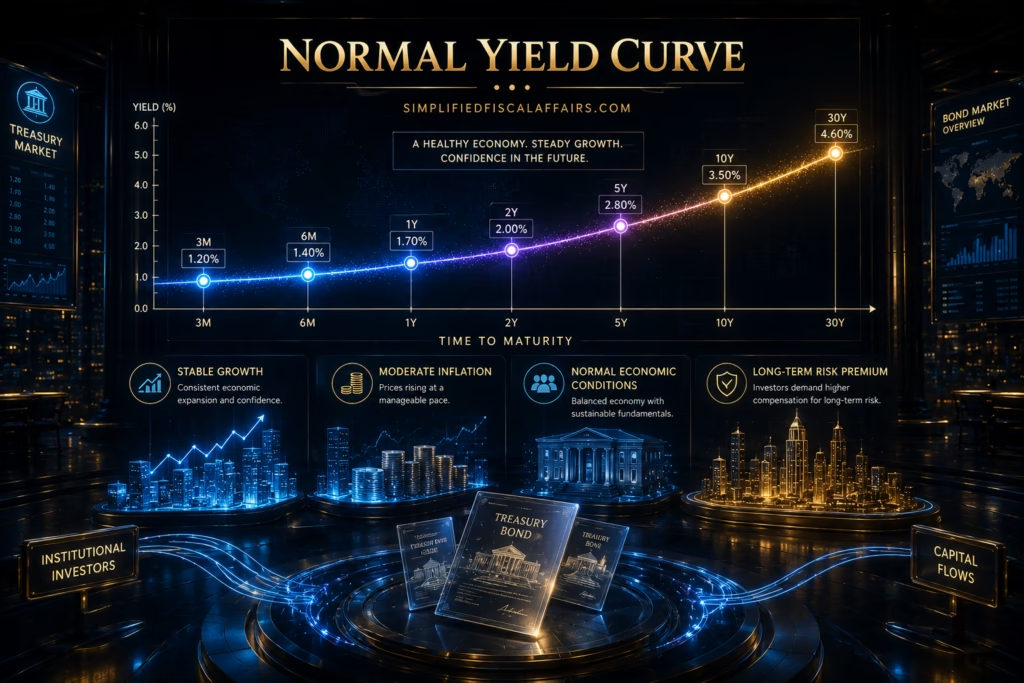
1. The Normal Yield Curve
In a normal yield curve:
- Short-term yields are lower.
- Long-term yields are higher.
This is generally associated with expectations of:
- Stable economic growth.
- Moderate inflation.
- Healthy financial conditions.
Investors demand additional compensation for lending money over longer periods because future conditions are less certain.
A gently upward-sloping curve is often viewed as a sign of a normally functioning economy.
2. The Flat Yield Curve
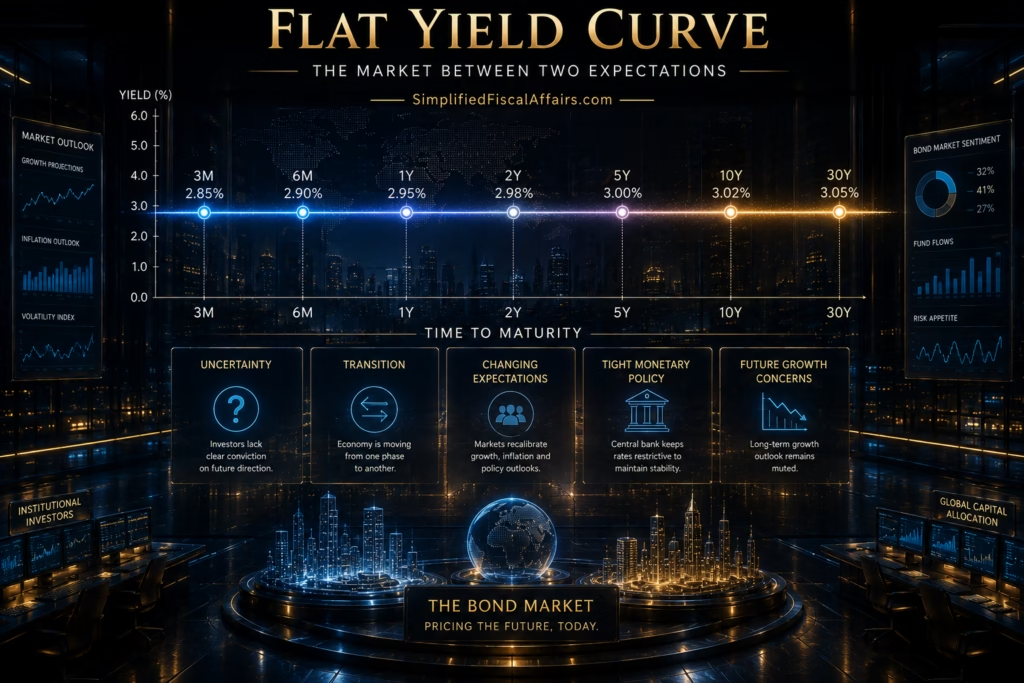
A flat yield curve occurs when short-term and long-term yields become similar.
This often reflects uncertainty.
Investors may be unsure whether economic growth will accelerate or slow.
A flat curve frequently appears during periods of economic transition, particularly when markets expect changes in monetary policy.
Although not necessarily a warning signal by itself, it often attracts increased attention from economists.
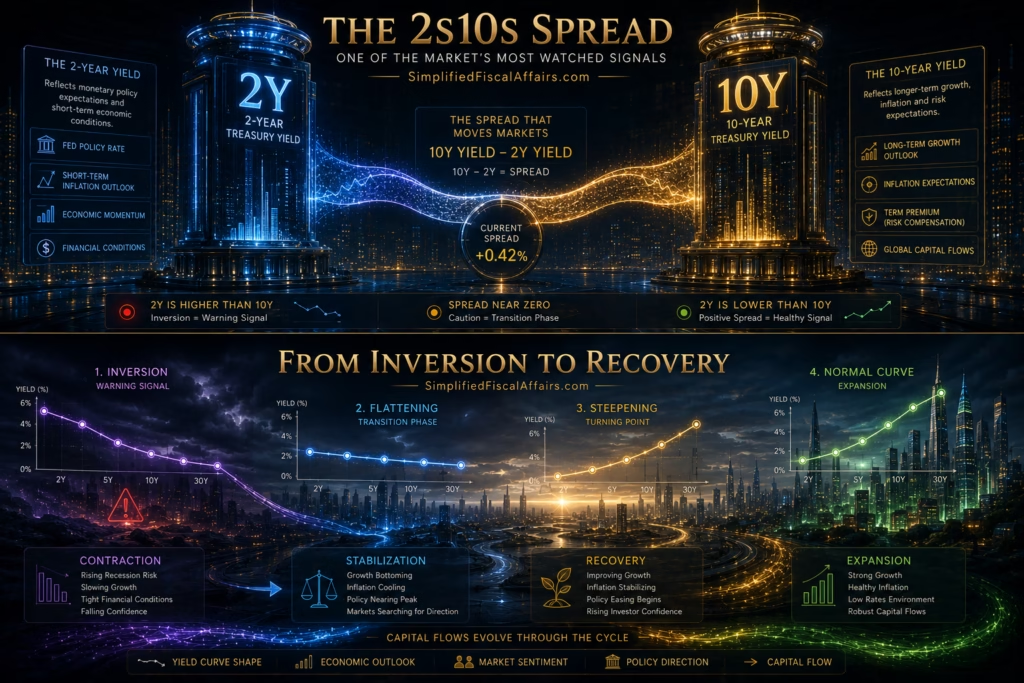
3. The Inverted Yield Curve
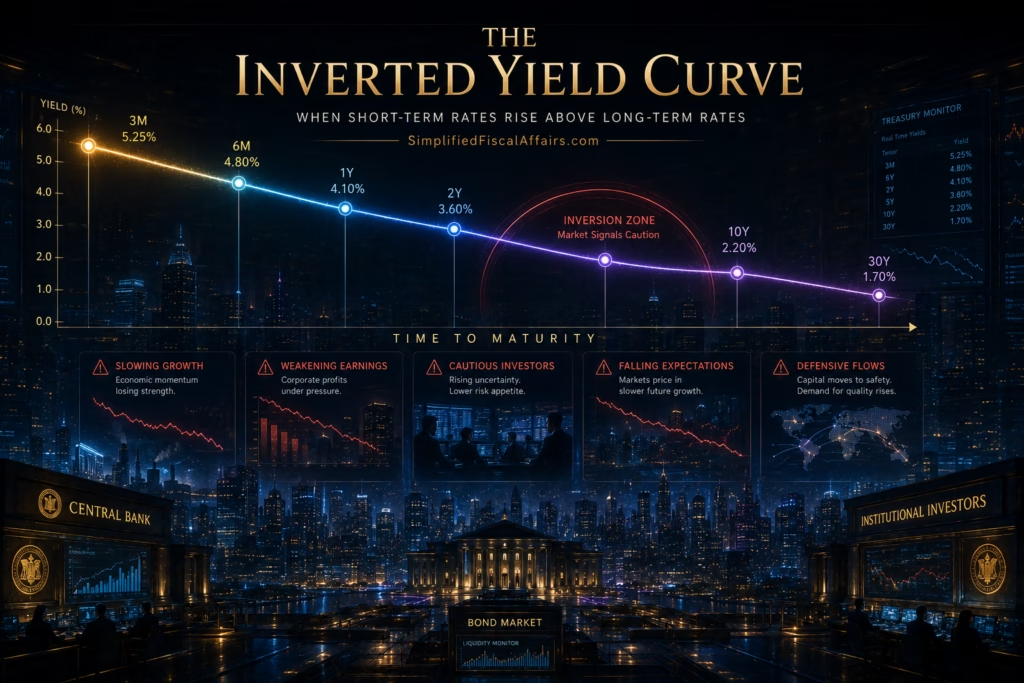
An inverted yield curve is the most unusual shape.
Here:
- Short-term yields exceed long-term yields.
At first glance, this seems illogical.
Why would investors accept lower returns for lending money over longer periods?
The answer lies in expectations.
If investors believe economic growth will weaken significantly, they may anticipate future reductions in interest rates.
As demand for long-term government bonds increases, their prices rise and their yields decline.
The resulting inversion has historically attracted considerable attention because it has often preceded periods of economic slowdown.
Why the Yield Curve Reflects Expectations
Unlike a single interest rate, the yield curve captures how investors collectively view the future.
Market participants continuously evaluate questions such as:
- Will inflation rise or fall?
- Will central banks increase or reduce policy rates?
- Will economic growth strengthen?
- Could unemployment increase?
- Are financial conditions becoming more restrictive?
Every bond trade represents a judgment about these possibilities.
The yield curve aggregates those judgments into one easily observable framework.
For this reason, economists often describe it as a market-based measure of expectations rather than a guaranteed forecast.
The Connection Between Prices and Yields
Recall one of the most important principles introduced earlier:
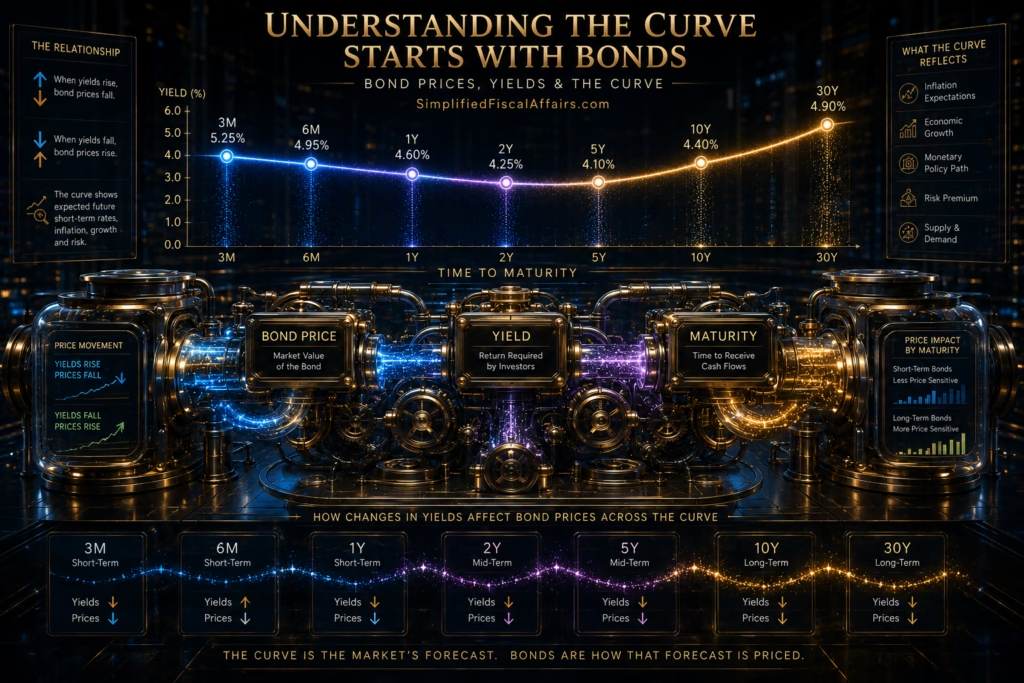
Bond prices and yields move in opposite directions.
When investors become concerned about future economic conditions, many seek the relative stability of longer-term government bonds.
Greater demand pushes bond prices higher.
Because prices and yields move inversely, long-term yields decline.
If short-term interest rates remain elevated while long-term yields fall, the yield curve can flatten or even invert.
This demonstrates how investor behavior directly influences the shape of the curve.
Why Central Banks Watch the Yield Curve
Central banks do not focus solely on today’s inflation or employment data.
They also monitor financial markets to understand how policy decisions are influencing expectations.
The yield curve provides valuable information about:
- Inflation expectations.
- Confidence in future economic growth.
- Financial conditions.
- Investor sentiment.
- Long-term borrowing costs.
Although policymakers consider many indicators, the yield curve is one of the most widely discussed because it summarizes information from millions of market participants.

Why Businesses Care
The yield curve affects much more than government borrowing.
Its shape influences:
- Corporate bond issuance.
- Mortgage interest rates.
- Infrastructure financing.
- Commercial lending.
- Investment decisions.
- Business expansion plans.
If long-term borrowing costs increase substantially, companies may delay major projects.
Conversely, lower long-term rates can encourage investment in factories, research, renewable energy, and other long-lived assets.
Thus, changes in the yield curve can influence economic activity well beyond financial markets.
A Practical Example
Imagine the following yields:
| Maturity | Yield |
|---|---|
| 3 Months | 4.8% |
| 2 Years | 4.5% |
| 10 Years | 4.1% |
| 30 Years | 3.9% |
Notice that yields decline as maturity increases.
This represents an inverted yield curve.
One possible interpretation is that investors expect future economic conditions to weaken sufficiently that interest rates may eventually fall.
It does not guarantee a recession.
Rather, it reflects the collective expectations embedded in market prices at that point in time.
Common Misconceptions
Many people believe:
“An inverted yield curve always causes a recession.”
It does not.
The curve itself does not create economic slowdowns.
Instead, it reflects investor expectations about future conditions.
Another misconception is:
“A normal yield curve means the economy is risk-free.”
No economic indicator can eliminate uncertainty.
Unexpected events, policy changes, technological developments, geopolitical risks, or financial shocks can alter economic outcomes.
The yield curve is a valuable indicator—but it should be interpreted alongside many other sources of information.
Institutional Insight
Large investment firms rarely rely on a single statistic.
When evaluating the yield curve, professional investors also consider:
- Inflation trends.
- Central bank communications.
- Labour market data.
- Fiscal policy.
- Credit spreads.
- Corporate earnings.
- Global economic conditions.
The yield curve is powerful precisely because it complements—not replaces—broader economic analysis.

Professional Investor’s Checklist
Before drawing conclusions from the yield curve, experienced analysts often ask:
✔ Is the curve normal, flat, or inverted?
✔ Which segment of the curve changed most significantly?
✔ Are inflation expectations shifting?
✔ How are central bank policies influencing short-term rates?
✔ Are investors seeking safety?
✔ Does the broader economic data support the same interpretation?
Chapter Summary
The yield curve is one of the most informative indicators in global finance because it illustrates how bond yields vary across different maturities.
Under normal conditions, longer-term bonds generally offer higher yields to compensate investors for greater uncertainty.
However, changing expectations about inflation, growth, and monetary policy can flatten or invert the curve.
Although the yield curve is not a perfect forecasting tool, it provides valuable insight into how financial markets collectively assess the future.
Understanding its shape allows investors to move beyond analyzing individual bonds and begin interpreting the broader signals sent by the fixed-income market.

← Previous Chapter The Rating That Can Move Billions: Bond Ratings Explained – IX
Next Chapter →Inflation and Bonds: The Silent Force That Can Increase or Destroy Investment Returns – XI
Coming Next
Chapter 11 – Inflation and Bonds: The Silent Force That Can Increase or Destroy Investment Returns
In the next chapter, you’ll discover:
- Why inflation is often described as the bond investor’s greatest long-term challenge.
- The difference between nominal returns and real returns.
- How inflation influences bond prices and yields.
- Why central banks closely monitor inflation when setting interest rates.
- How professional investors seek to protect purchasing power in an inflationary environment.
By the end of the next chapter, you’ll understand why earning a positive return is not enough—what truly matters is preserving and growing your purchasing power after inflation.

Disclaimer
This article is published solely for educational, informational, and public awareness purposes. Any companies, organizations, financial institutions, individuals, financial data or scenarios mentioned are used for explanatory or illustrative purposes only. Documentary-style narratives, hypothetical examples, and reconstructed investigative scenarios are intended to help readers understand forensic auditing concepts and should not be interpreted as factual accounts of any specific ongoing investigation.
The information presented does not constitute legal, accounting, auditing, financial, investment, or professional advice. While every effort has been made to ensure accuracy, readers should consult qualified legal, accounting, forensic, or financial professionals before making decisions based on the information contained in this article.
SimplifiedFiscalAffairs.com does not make any allegations against any person, company, or institution, nor does it endorse or condemn any entity referenced. References to publicly known corporate frauds or legal cases are based on information available in the public domain and are included solely for educational analysis.
The publisher and author disclaim any liability for actions taken based on the contents of this article.